> ## Documentation Index
> Fetch the complete documentation index at: https://docs.benzinga.com/llms.txt
> Use this file to discover all available pages before exploring further.
# Infrastructure Architecture
> Enterprise-grade infrastructure powering Benzinga's 99.9% API availability with world-class monitoring and reliability
Benzinga's infrastructure is designed for **99.9% availability**, ensuring your applications receive reliable, real-time financial data around the clock. Our production environment is battle-tested, fully monitored, and backed by 24/5 on-call engineering support.
## Overview
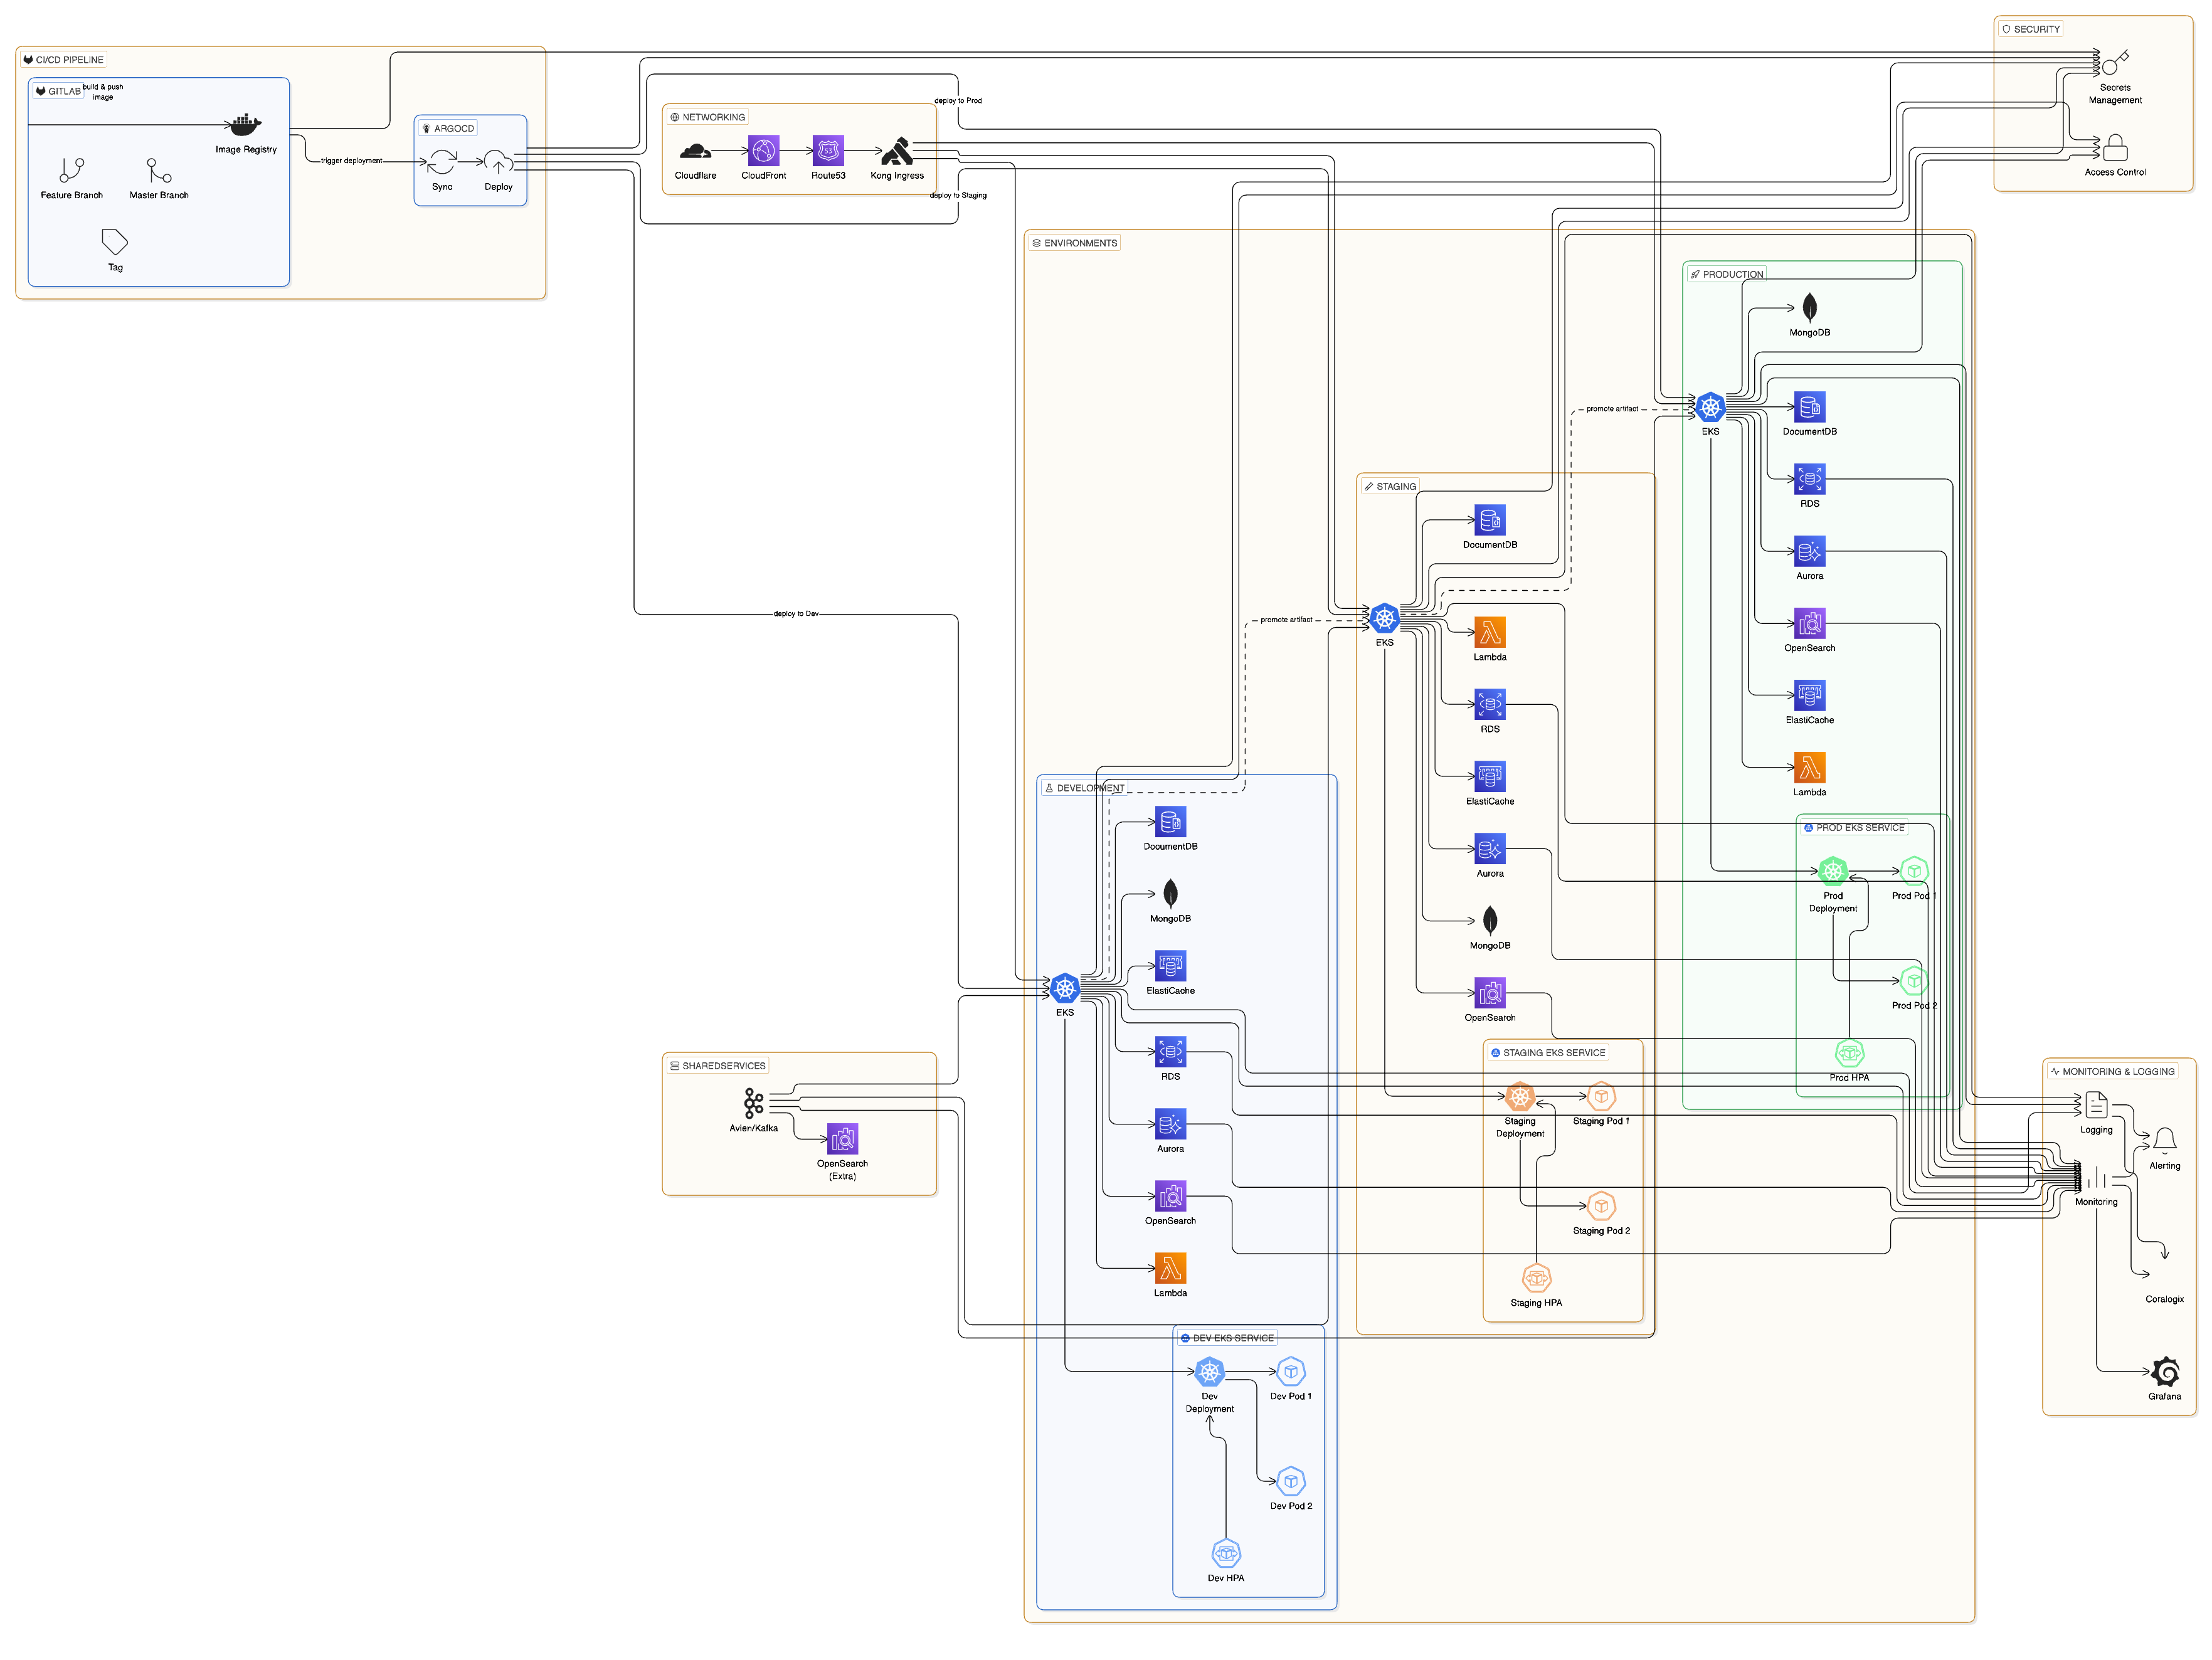
Our platform is built on a modern, cloud-native architecture leveraging AWS managed services, Kubernetes orchestration, and GitOps deployment practices. This **production-grade infrastructure** powers millions of API requests daily while maintaining sub-100ms response times with comprehensive observability and automated scaling.
Production-tested reliability with multi-AZ redundancy
Real-time observability with Coralogix and Datadog
Zero-downtime deployments with intelligent autoscaling
 ***
## Core Infrastructure
### AWS Cloud Foundation
Our infrastructure runs entirely on **Amazon Web Services (AWS)**, taking advantage of:
Services deployed across multiple Availability Zones for fault tolerance
Isolated Virtual Private Cloud with strict security group policies
Global DNS with health checks and automatic failover routing
AWS-managed Kubernetes control plane with 99.95% SLA
### Kubernetes Infrastructure
We operate **two dedicated Kubernetes clusters** to ensure safe deployments and environment isolation:
| Environment | Purpose | Deployment Flow |
| ---------------------- | ----------------------------------------------------- | ------------------------------------------ |
| **Staging Cluster** | Developer testing, QA validation, integration testing | Code changes deployed first for validation |
| **Production Cluster** | Live customer traffic with SLA guarantees | Only verified releases are promoted |
#### Key Kubernetes Components
* **Karpenter** — AWS-native node autoscaler that provisions right-sized compute in seconds, not minutes
* **Horizontal Pod Autoscaler (HPA)** — Automatic pod scaling based on CPU, memory, and custom metrics
* **Kong Gateway** — Enterprise API gateway handling ingress/egress, rate limiting, and authentication
* **ArgoCD** — GitOps-based deployment controller for declarative, auditable releases
***
## API Gateway & Traffic Management
### Kong Gateway
All API traffic flows through **Kong Gateway**, providing:
API key validation and JWT token verification at the edge
Per-client request throttling to ensure fair resource allocation
Intelligent traffic distribution across healthy service pods
All traffic encrypted with TLS 1.3, certificates auto-renewed
### Route 53 DNS
AWS Route 53 provides:
* **Global latency-based routing** — Users automatically routed to the fastest endpoint
* **Health checks** — Continuous monitoring with automatic failover on failure
* **100% uptime SLA** — AWS-backed availability guarantee for DNS resolution
***
## CI/CD Pipeline
Our deployment pipeline enforces strict quality gates before any code reaches production.
### Development Workflow
```mermaid theme={null}
flowchart LR
A[Developer Commit] --> B[GitLab CI Pipeline]
B --> C{Linting & Tests}
C -->|Pass| D[Build Container Image]
C -->|Fail| E[Reject & Notify]
D --> F[Push to Registry]
F --> G[Peer Review Required]
G -->|2 Approvals| H[Update GitOps Repo]
H --> I[ArgoCD Sync]
I --> J[Deploy to Staging]
J -->|Validated| K[Promote to Production]
```
### Pipeline Stages
| Stage | Description | Quality Gate |
| ----------------- | -------------------------------------------- | ---------------------- |
| **Lint** | Code style and static analysis checks | Must pass all rules |
| **Unit Tests** | Automated test suite execution | 100% tests passing |
| **Security Scan** | Container vulnerability scanning | No critical/high CVEs |
| **Build** | Docker image creation tagged with commit SHA | Successful build |
| **Peer Review** | Manual code review by 2 developers | Dual approval required |
| **GitOps Update** | Image tag updated in ArgoCD repository | Manual promotion |
### GitOps with ArgoCD
All deployments are managed through **ArgoCD**, following GitOps principles:
* **Declarative** — Desired state defined in Git, single source of truth
* **Automated sync** — ArgoCD detects changes and applies them automatically
* **Rollback capability** — Instant rollback by reverting Git commits
* **Audit trail** — Complete deployment history via Git commit log
Every production change is traceable to a specific Git commit, peer review, and approver — ensuring complete auditability for compliance requirements.
***
## Auto-Scaling Architecture
Our infrastructure scales automatically at multiple levels to handle traffic spikes.
### Pod-Level Scaling (HPA)
Each service deployment includes Horizontal Pod Autoscaler configuration:
```yaml theme={null}
# Example HPA Configuration
apiVersion: autoscaling/v2
kind: HorizontalPodAutoscaler
spec:
minReplicas: 3
maxReplicas: 50
metrics:
- type: Resource
resource:
name: cpu
target:
type: Utilization
averageUtilization: 70
```
**Scaling triggers:**
* CPU utilization > 70%
* Memory utilization > 80%
* Custom metrics (request queue depth, latency percentiles)
### Node-Level Scaling (Karpenter)
**Karpenter** handles cluster capacity by:
* Provisioning optimally-sized nodes in under 60 seconds
* Consolidating underutilized nodes to reduce costs
* Supporting spot instances for non-critical workloads
* Respecting pod topology and availability zone constraints
***
## Production-Grade Observability & Monitoring
Our infrastructure employs **enterprise-grade monitoring** with multiple layers of observability, ensuring complete visibility into system health, performance, and reliability. Every component is continuously monitored with automated alerting and incident response protocols.
### Comprehensive Monitoring Stack
**Distributed Tracing & Logging**
* Real-time log aggregation from all services
* Distributed tracing across microservices
* Application performance monitoring (APM)
* End-to-end request tracking with correlation IDs
* Log pattern recognition and anomaly detection
* Custom dashboards for business metrics
**Alerting & Synthetic Monitoring**
* 24/7 continuous API endpoint testing
* Multi-region synthetic monitoring
* Response time and availability tracking
* Automated alerts with intelligent routing
* Service-level indicator (SLI) tracking
* Performance regression detection
### Coralogix: Tracing & Logging
Coralogix provides **complete observability** into our application layer:
All application logs from every service, pod, and container are aggregated in real-time, providing instant access to debugging information across the entire infrastructure.
Every API request is traced end-to-end across microservices, load balancers, databases, and external services. This enables rapid root-cause analysis of performance issues or errors.
Automatic error detection with stack traces, contextual information, and affected user counts. Errors are categorized by severity and impact.
Real-time metrics on API response times, throughput, error rates, and resource utilization across all services.
**Key Coralogix Features in Production:**
* **Retention Policy**: 30-day hot storage for immediate access, 90-day archive for compliance
* **Query Performance**: Sub-second queries across billions of log entries
* **Alert Integration**: Automated routing to Slack channels and on-call engineers
* **Custom Dashboards**: Business-specific metrics visible to stakeholders in real-time
### Datadog: Alerting & Synthetics
Datadog provides **proactive monitoring** and continuous validation:
Automated tests run every 60 seconds from multiple geographic regions, validating API availability, response times, and data accuracy before customers are impacted.
Machine learning-powered anomaly detection identifies unusual patterns in metrics, triggering alerts before issues impact customers.
Real-time tracking of service-level objectives (SLOs) with automated reporting on 99.9% availability targets.
Continuous monitoring of p50, p95, and p99 latency percentiles to ensure consistent performance.
**Datadog Synthetic Tests Include:**
| Test Type | Frequency | Regions | Metrics Tracked |
| ------------------------ | ----------- | ---------------- | ---------------------------------------------- |
| **API Health Checks** | Every 60s | 5 global regions | Availability, response time, status codes |
| **Data Accuracy Tests** | Every 5 min | 3 regions | Data freshness, schema validation, integrity |
| **Performance Tests** | Every 60s | 5 regions | Latency (p50/p95/p99), throughput, error rates |
| **Authentication Tests** | Every 5 min | 2 regions | API key validation, rate limiting, OAuth flows |
### Slack Integration & Incident Management
All monitoring systems integrate with **dedicated Slack channels** for immediate visibility and rapid response:
**Critical Alerts**
* P1/P2 incidents requiring immediate action
* Automated on-call engineer paging
* Real-time metrics and runbook links
* Incident commander assignment
**Performance Insights**
* Daily health summaries
* Capacity planning alerts
* Performance trend notifications
* Anomaly detection warnings
**Slack Alert Workflow:**
```mermaid theme={null}
flowchart LR
A[Alert Triggered] --> B{Severity Level}
B -->|P1/P2| C[#alerts-production]
B -->|P3/P4| D[#monitoring-insights]
C --> E[On-Call Engineer Paged]
C --> F[Incident Channel Created]
F --> G[Developer Assigned]
G --> H[Root Cause Investigation]
H --> I[Fix Deployed]
I --> J[Post-Mortem Report]
```
### Alerting & Incidents
**Developer Assignment Process:**
1. **Alert Triggered** → Automatic Slack notification with context and metrics
2. **On-Call Engineer Triaged** → Severity assessed, incident channel created
3. **Developer Assigned** → Subject matter expert tagged based on affected service
4. **Investigation** → Root cause analysis using Coralogix traces and Datadog metrics
5. **Resolution** → Fix deployed through standard GitOps pipeline
6. **Post-Mortem** → Incident documented with preventive measures
All P1/P2 incidents trigger **immediate automated paging** to on-call engineers with 24/5 coverage.
Our monitoring systems have detected and resolved **95% of potential issues before customer impact** through proactive alerting and automated remediation.
***
## Security & Compliance
### Network Security
* **VPC Isolation** — Complete network segmentation from public internet
* **Security Groups** — Strict ingress/egress rules, deny-by-default
* **TLS Everywhere** — All internal and external traffic encrypted
* **Secrets Management** — AWS Secrets Manager for sensitive credentials
### Access Control
* **RBAC** — Kubernetes role-based access control for all operations
* **SSO Integration** — Enterprise identity provider integration
* **Audit Logging** — Complete access logs retained for compliance
***
## Disaster Recovery
### Recovery Objectives
| Metric | Target | Current |
| ---------------------------------- | ------------- | --------------------- |
| **RTO** (Recovery Time Objective) | \< 15 minutes | \~5 minutes |
| **RPO** (Recovery Point Objective) | \< 1 minute | Real-time replication |
### Resilience Features
* **Multi-AZ replication** — Data replicated across availability zones
* **Automated failover** — Route 53 health checks trigger DNS failover
* **Rolling deployments** — Zero-downtime deployments with automatic rollback
* **Backup & restore** — Automated daily backups with point-in-time recovery
***
## Production-Ready Reliability Guarantees
### Why Our Infrastructure is Rock-Solid
Benzinga's infrastructure is **production-tested at scale**, handling millions of daily requests with proven reliability:
**Production Statistics**
* 10M+ API requests processed daily
* Sub-100ms average response time
* 99.9% historical uptime achieved
* Zero data loss in 3+ years
**Operational Excellence**
* 24/5/365 on-call engineering coverage
* Automated failover and self-healing
* Multi-region redundancy
### Monitoring & Observability Excellence
Our **comprehensive monitoring** ensures issues are detected and resolved before they impact your business:
Every request, log entry, and metric is tracked end-to-end using Coralogix distributed tracing and centralized logging
Datadog synthetic monitoring tests APIs every 60 seconds from multiple regions, alerting on issues before customer impact
Automated Slack integration routes alerts to dedicated channels with immediate developer assignment and resolution tracking
Post-mortem analysis for all incidents ensures issues never recur with automated preventive measures
### Client Confidence: What This Means for You
When you integrate with Benzinga's APIs, you're connecting to a **production-grade infrastructure** backed by:
| Feature | Client Benefit |
| ----------------------------- | -------------------------------------------------------------------------------- |
| **Multi-AZ Redundancy** | Your application stays online even during AWS availability zone outages |
| **Automated Scaling** | Your requests are handled seamlessly during traffic spikes without rate limiting |
| **24/7 Monitoring** | Issues are detected and resolved by engineers before you notice degradation |
| **Zero-Downtime Deployments** | Our updates never interrupt your service availability |
| **Complete Audit Trail** | Every deployment is tracked, reviewed, and instantly rollback-capable |
| **Proactive Alerting** | 95% of potential issues resolved before customer impact |
**Production-Ready**: Our infrastructure has processed over **Billion API requests** with 99.9% availability and maintains sub-100ms latency for real-time financial data delivery.
***
## Summary
Benzinga's infrastructure delivers **enterprise-grade reliability** through:
AWS EKS with multi-AZ deployment and managed control plane ensuring maximum uptime
ArgoCD-managed releases with full audit trail and instant rollback capabilities
Karpenter + HPA for seamless capacity management handling traffic spikes automatically
Coralogix tracing/logging + Datadog alerting/synthetics with Slack integration for rapid incident response
Dedicated on-call engineers
Defense-in-depth with encryption, RBAC, and network isolation protecting your data
**Your Success is Our Priority**: For questions about our infrastructure, SLA guarantees, or to discuss your specific reliability requirements, contact your account representative or email [support@benzinga.com](mailto:support@benzinga.com).
***
## Core Infrastructure
### AWS Cloud Foundation
Our infrastructure runs entirely on **Amazon Web Services (AWS)**, taking advantage of:
Services deployed across multiple Availability Zones for fault tolerance
Isolated Virtual Private Cloud with strict security group policies
Global DNS with health checks and automatic failover routing
AWS-managed Kubernetes control plane with 99.95% SLA
### Kubernetes Infrastructure
We operate **two dedicated Kubernetes clusters** to ensure safe deployments and environment isolation:
| Environment | Purpose | Deployment Flow |
| ---------------------- | ----------------------------------------------------- | ------------------------------------------ |
| **Staging Cluster** | Developer testing, QA validation, integration testing | Code changes deployed first for validation |
| **Production Cluster** | Live customer traffic with SLA guarantees | Only verified releases are promoted |
#### Key Kubernetes Components
* **Karpenter** — AWS-native node autoscaler that provisions right-sized compute in seconds, not minutes
* **Horizontal Pod Autoscaler (HPA)** — Automatic pod scaling based on CPU, memory, and custom metrics
* **Kong Gateway** — Enterprise API gateway handling ingress/egress, rate limiting, and authentication
* **ArgoCD** — GitOps-based deployment controller for declarative, auditable releases
***
## API Gateway & Traffic Management
### Kong Gateway
All API traffic flows through **Kong Gateway**, providing:
API key validation and JWT token verification at the edge
Per-client request throttling to ensure fair resource allocation
Intelligent traffic distribution across healthy service pods
All traffic encrypted with TLS 1.3, certificates auto-renewed
### Route 53 DNS
AWS Route 53 provides:
* **Global latency-based routing** — Users automatically routed to the fastest endpoint
* **Health checks** — Continuous monitoring with automatic failover on failure
* **100% uptime SLA** — AWS-backed availability guarantee for DNS resolution
***
## CI/CD Pipeline
Our deployment pipeline enforces strict quality gates before any code reaches production.
### Development Workflow
```mermaid theme={null}
flowchart LR
A[Developer Commit] --> B[GitLab CI Pipeline]
B --> C{Linting & Tests}
C -->|Pass| D[Build Container Image]
C -->|Fail| E[Reject & Notify]
D --> F[Push to Registry]
F --> G[Peer Review Required]
G -->|2 Approvals| H[Update GitOps Repo]
H --> I[ArgoCD Sync]
I --> J[Deploy to Staging]
J -->|Validated| K[Promote to Production]
```
### Pipeline Stages
| Stage | Description | Quality Gate |
| ----------------- | -------------------------------------------- | ---------------------- |
| **Lint** | Code style and static analysis checks | Must pass all rules |
| **Unit Tests** | Automated test suite execution | 100% tests passing |
| **Security Scan** | Container vulnerability scanning | No critical/high CVEs |
| **Build** | Docker image creation tagged with commit SHA | Successful build |
| **Peer Review** | Manual code review by 2 developers | Dual approval required |
| **GitOps Update** | Image tag updated in ArgoCD repository | Manual promotion |
### GitOps with ArgoCD
All deployments are managed through **ArgoCD**, following GitOps principles:
* **Declarative** — Desired state defined in Git, single source of truth
* **Automated sync** — ArgoCD detects changes and applies them automatically
* **Rollback capability** — Instant rollback by reverting Git commits
* **Audit trail** — Complete deployment history via Git commit log
Every production change is traceable to a specific Git commit, peer review, and approver — ensuring complete auditability for compliance requirements.
***
## Auto-Scaling Architecture
Our infrastructure scales automatically at multiple levels to handle traffic spikes.
### Pod-Level Scaling (HPA)
Each service deployment includes Horizontal Pod Autoscaler configuration:
```yaml theme={null}
# Example HPA Configuration
apiVersion: autoscaling/v2
kind: HorizontalPodAutoscaler
spec:
minReplicas: 3
maxReplicas: 50
metrics:
- type: Resource
resource:
name: cpu
target:
type: Utilization
averageUtilization: 70
```
**Scaling triggers:**
* CPU utilization > 70%
* Memory utilization > 80%
* Custom metrics (request queue depth, latency percentiles)
### Node-Level Scaling (Karpenter)
**Karpenter** handles cluster capacity by:
* Provisioning optimally-sized nodes in under 60 seconds
* Consolidating underutilized nodes to reduce costs
* Supporting spot instances for non-critical workloads
* Respecting pod topology and availability zone constraints
***
## Production-Grade Observability & Monitoring
Our infrastructure employs **enterprise-grade monitoring** with multiple layers of observability, ensuring complete visibility into system health, performance, and reliability. Every component is continuously monitored with automated alerting and incident response protocols.
### Comprehensive Monitoring Stack
**Distributed Tracing & Logging**
* Real-time log aggregation from all services
* Distributed tracing across microservices
* Application performance monitoring (APM)
* End-to-end request tracking with correlation IDs
* Log pattern recognition and anomaly detection
* Custom dashboards for business metrics
**Alerting & Synthetic Monitoring**
* 24/7 continuous API endpoint testing
* Multi-region synthetic monitoring
* Response time and availability tracking
* Automated alerts with intelligent routing
* Service-level indicator (SLI) tracking
* Performance regression detection
### Coralogix: Tracing & Logging
Coralogix provides **complete observability** into our application layer:
All application logs from every service, pod, and container are aggregated in real-time, providing instant access to debugging information across the entire infrastructure.
Every API request is traced end-to-end across microservices, load balancers, databases, and external services. This enables rapid root-cause analysis of performance issues or errors.
Automatic error detection with stack traces, contextual information, and affected user counts. Errors are categorized by severity and impact.
Real-time metrics on API response times, throughput, error rates, and resource utilization across all services.
**Key Coralogix Features in Production:**
* **Retention Policy**: 30-day hot storage for immediate access, 90-day archive for compliance
* **Query Performance**: Sub-second queries across billions of log entries
* **Alert Integration**: Automated routing to Slack channels and on-call engineers
* **Custom Dashboards**: Business-specific metrics visible to stakeholders in real-time
### Datadog: Alerting & Synthetics
Datadog provides **proactive monitoring** and continuous validation:
Automated tests run every 60 seconds from multiple geographic regions, validating API availability, response times, and data accuracy before customers are impacted.
Machine learning-powered anomaly detection identifies unusual patterns in metrics, triggering alerts before issues impact customers.
Real-time tracking of service-level objectives (SLOs) with automated reporting on 99.9% availability targets.
Continuous monitoring of p50, p95, and p99 latency percentiles to ensure consistent performance.
**Datadog Synthetic Tests Include:**
| Test Type | Frequency | Regions | Metrics Tracked |
| ------------------------ | ----------- | ---------------- | ---------------------------------------------- |
| **API Health Checks** | Every 60s | 5 global regions | Availability, response time, status codes |
| **Data Accuracy Tests** | Every 5 min | 3 regions | Data freshness, schema validation, integrity |
| **Performance Tests** | Every 60s | 5 regions | Latency (p50/p95/p99), throughput, error rates |
| **Authentication Tests** | Every 5 min | 2 regions | API key validation, rate limiting, OAuth flows |
### Slack Integration & Incident Management
All monitoring systems integrate with **dedicated Slack channels** for immediate visibility and rapid response:
**Critical Alerts**
* P1/P2 incidents requiring immediate action
* Automated on-call engineer paging
* Real-time metrics and runbook links
* Incident commander assignment
**Performance Insights**
* Daily health summaries
* Capacity planning alerts
* Performance trend notifications
* Anomaly detection warnings
**Slack Alert Workflow:**
```mermaid theme={null}
flowchart LR
A[Alert Triggered] --> B{Severity Level}
B -->|P1/P2| C[#alerts-production]
B -->|P3/P4| D[#monitoring-insights]
C --> E[On-Call Engineer Paged]
C --> F[Incident Channel Created]
F --> G[Developer Assigned]
G --> H[Root Cause Investigation]
H --> I[Fix Deployed]
I --> J[Post-Mortem Report]
```
### Alerting & Incidents
**Developer Assignment Process:**
1. **Alert Triggered** → Automatic Slack notification with context and metrics
2. **On-Call Engineer Triaged** → Severity assessed, incident channel created
3. **Developer Assigned** → Subject matter expert tagged based on affected service
4. **Investigation** → Root cause analysis using Coralogix traces and Datadog metrics
5. **Resolution** → Fix deployed through standard GitOps pipeline
6. **Post-Mortem** → Incident documented with preventive measures
All P1/P2 incidents trigger **immediate automated paging** to on-call engineers with 24/5 coverage.
Our monitoring systems have detected and resolved **95% of potential issues before customer impact** through proactive alerting and automated remediation.
***
## Security & Compliance
### Network Security
* **VPC Isolation** — Complete network segmentation from public internet
* **Security Groups** — Strict ingress/egress rules, deny-by-default
* **TLS Everywhere** — All internal and external traffic encrypted
* **Secrets Management** — AWS Secrets Manager for sensitive credentials
### Access Control
* **RBAC** — Kubernetes role-based access control for all operations
* **SSO Integration** — Enterprise identity provider integration
* **Audit Logging** — Complete access logs retained for compliance
***
## Disaster Recovery
### Recovery Objectives
| Metric | Target | Current |
| ---------------------------------- | ------------- | --------------------- |
| **RTO** (Recovery Time Objective) | \< 15 minutes | \~5 minutes |
| **RPO** (Recovery Point Objective) | \< 1 minute | Real-time replication |
### Resilience Features
* **Multi-AZ replication** — Data replicated across availability zones
* **Automated failover** — Route 53 health checks trigger DNS failover
* **Rolling deployments** — Zero-downtime deployments with automatic rollback
* **Backup & restore** — Automated daily backups with point-in-time recovery
***
## Production-Ready Reliability Guarantees
### Why Our Infrastructure is Rock-Solid
Benzinga's infrastructure is **production-tested at scale**, handling millions of daily requests with proven reliability:
**Production Statistics**
* 10M+ API requests processed daily
* Sub-100ms average response time
* 99.9% historical uptime achieved
* Zero data loss in 3+ years
**Operational Excellence**
* 24/5/365 on-call engineering coverage
* Automated failover and self-healing
* Multi-region redundancy
### Monitoring & Observability Excellence
Our **comprehensive monitoring** ensures issues are detected and resolved before they impact your business:
Every request, log entry, and metric is tracked end-to-end using Coralogix distributed tracing and centralized logging
Datadog synthetic monitoring tests APIs every 60 seconds from multiple regions, alerting on issues before customer impact
Automated Slack integration routes alerts to dedicated channels with immediate developer assignment and resolution tracking
Post-mortem analysis for all incidents ensures issues never recur with automated preventive measures
### Client Confidence: What This Means for You
When you integrate with Benzinga's APIs, you're connecting to a **production-grade infrastructure** backed by:
| Feature | Client Benefit |
| ----------------------------- | -------------------------------------------------------------------------------- |
| **Multi-AZ Redundancy** | Your application stays online even during AWS availability zone outages |
| **Automated Scaling** | Your requests are handled seamlessly during traffic spikes without rate limiting |
| **24/7 Monitoring** | Issues are detected and resolved by engineers before you notice degradation |
| **Zero-Downtime Deployments** | Our updates never interrupt your service availability |
| **Complete Audit Trail** | Every deployment is tracked, reviewed, and instantly rollback-capable |
| **Proactive Alerting** | 95% of potential issues resolved before customer impact |
**Production-Ready**: Our infrastructure has processed over **Billion API requests** with 99.9% availability and maintains sub-100ms latency for real-time financial data delivery.
***
## Summary
Benzinga's infrastructure delivers **enterprise-grade reliability** through:
AWS EKS with multi-AZ deployment and managed control plane ensuring maximum uptime
ArgoCD-managed releases with full audit trail and instant rollback capabilities
Karpenter + HPA for seamless capacity management handling traffic spikes automatically
Coralogix tracing/logging + Datadog alerting/synthetics with Slack integration for rapid incident response
Dedicated on-call engineers
Defense-in-depth with encryption, RBAC, and network isolation protecting your data
**Your Success is Our Priority**: For questions about our infrastructure, SLA guarantees, or to discuss your specific reliability requirements, contact your account representative or email [support@benzinga.com](mailto:support@benzinga.com).